[Skip to Content]
X
Port
History
Board of Commissioners
Senior Staff
Employees
Code of Conduct
Human Resources
Seaport
Facts & Figures
Seaport Facilities
Seaport Resources
Trucker Resources
Development
Webcam
Airport
Airport Business
Airport Travelers
Airport Special Projects
Business
Commercial Real Estate
Careers
Port Utilities
Standard Contract Provisions
Bids/RFPs/Permits
Purchasing & Accounts Payable
Business Events
Building & Development Permits
Community
Social Responsibility
Your Port. Your Community.
Parks & Waterways
Economic Impact
Environment
Recreation
Resources
Media & Newsroom
Contact Us
Government Affairs
In the News
Public Records Requests (PRA)
Government Claim Form
Financial Information
Publications & Documents
Service of Process During Local Emergency
Select language
Everyone’s Port
Seaport Map
Oakland Portal
Port Code
Media & Newsroom
Careers
Bids/RFPs
Contact Us
Civil Rights
公民权利
Derechos civiles
Port
Seaport
Airport
Commercial Real Estate
Social Responsibility
History
Employees
Board of Commissioners
Senior Staff
Community
Port in the Community
Parks & Waterways
Economic Impact
Environmental Stewardship
Recreation
Business
Human Resources
Careers
Bids/RFPs/Permits
Properties For Lease
Board Agenda
View Meetings Live
JOIN US
Full Menu
Home
[:en]Progress Report 2018 – 2019[:]
By the Numbers
By the Numbers
Fiscal Year 2017 vs 2018 Financial Figures
$ in Millions
FY 2017 Actual
FY 2018 Actual
Operating Revenues, Expenses & Income
Operating Revenues by Division
Debt Service & Debt Service Coverage Ratio
Capital Expense and Cash
Port Sources of Funds
Oak Monthly Passengers: Year over Year Growth
Passengers 2017 vs 2018
Historical Passenger Activity
Full TEUs 2017 vs 2018
Full TEUs FY2009 - FY2018
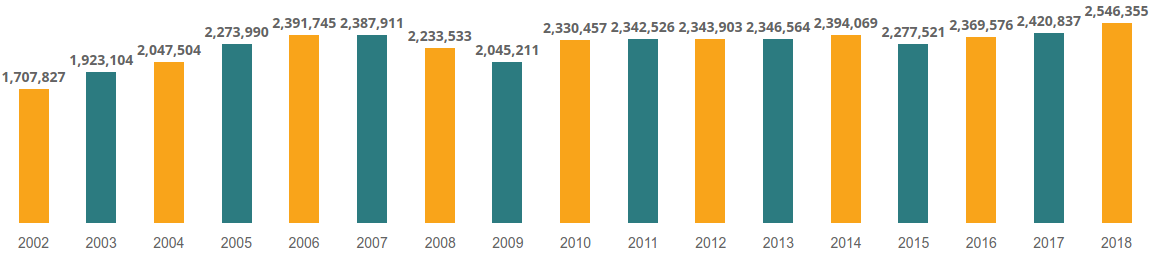
Total TEU Activity (2002-2018)
© 2024 Copyright
Terms of Use and Privacy Policy
Sitemap
Site Design by Ciniva Web Agency