By the Numbers
Fiscal Year 2016 vs 2017 Financial Metrics
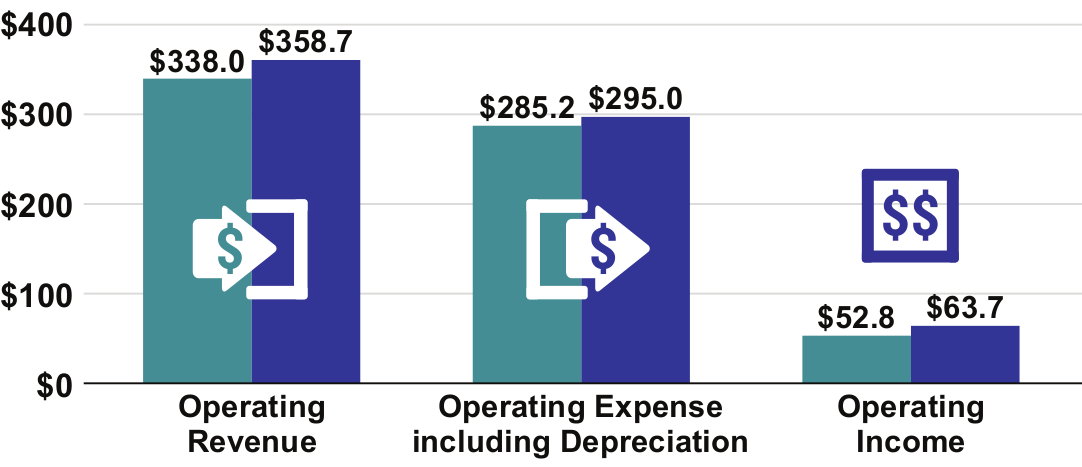
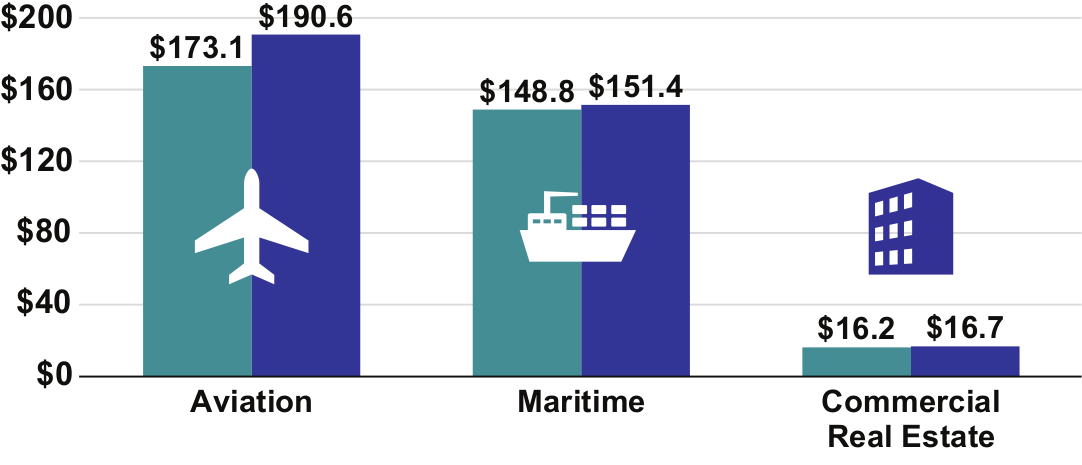
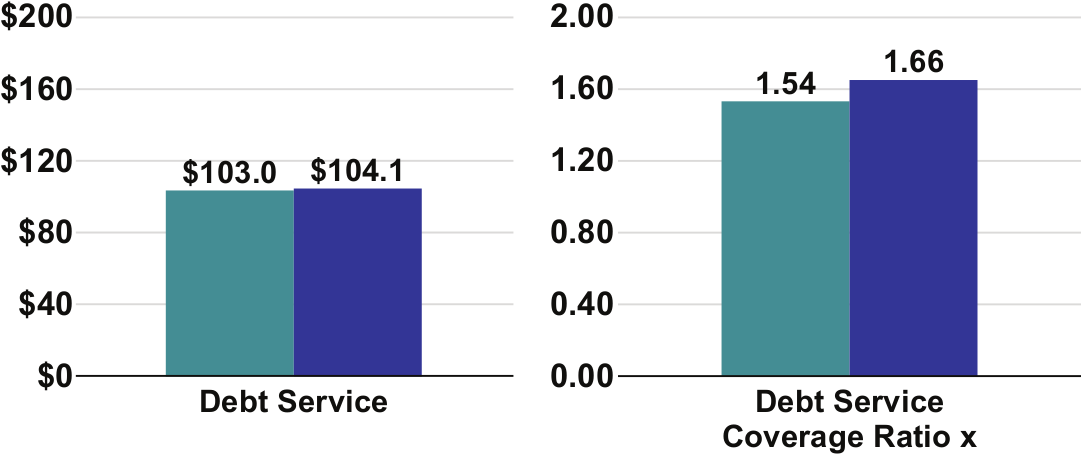
- $ in Millions
- FY 2016 Actual
- FY 2017 Actual
Operating Revenues, Expenses & Income
Operating Revenues by Division
Debt Service & Debt Service Coverage Ratio
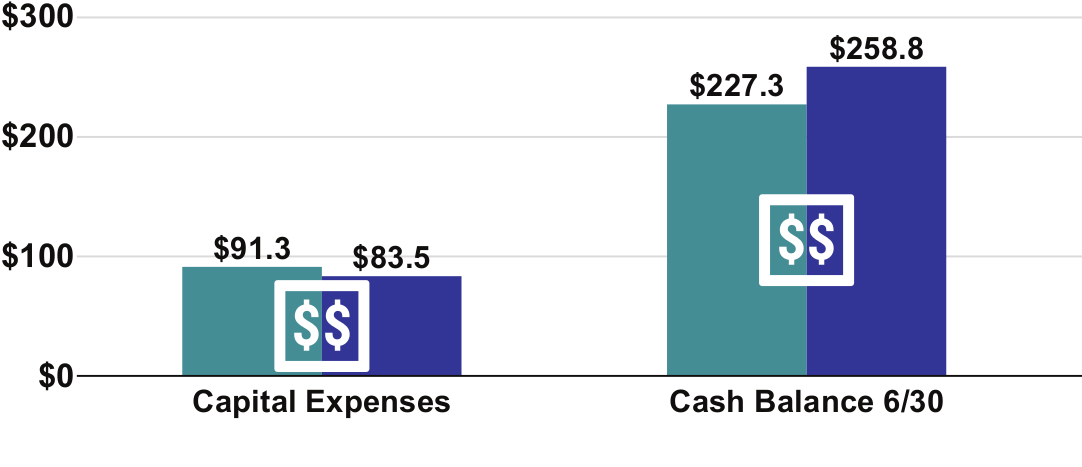
Capital Expense and Cash
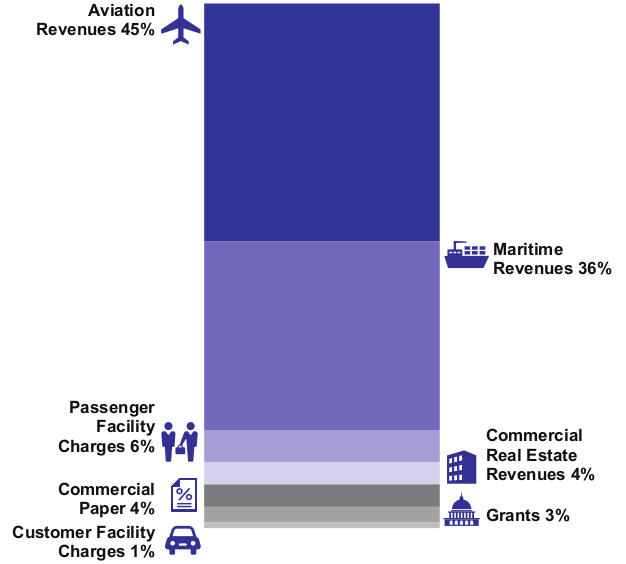
Port Sources of Funds
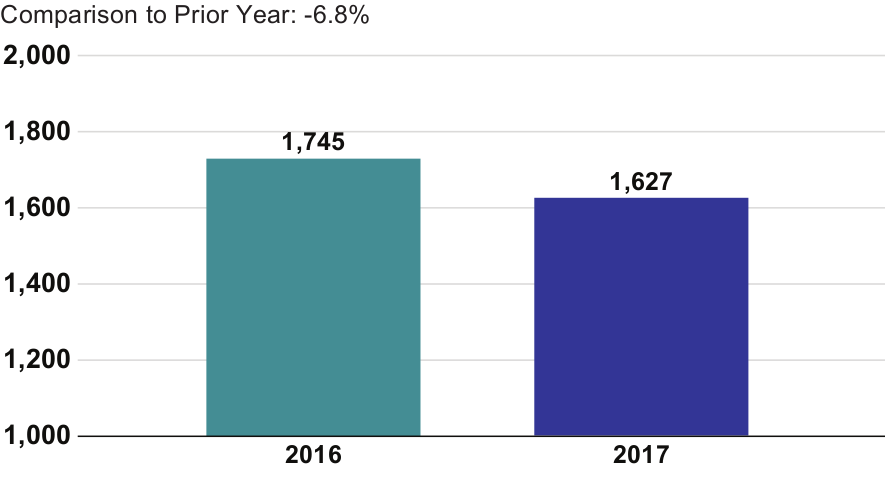
Oak Monthly Passengers: Year over Year Growth
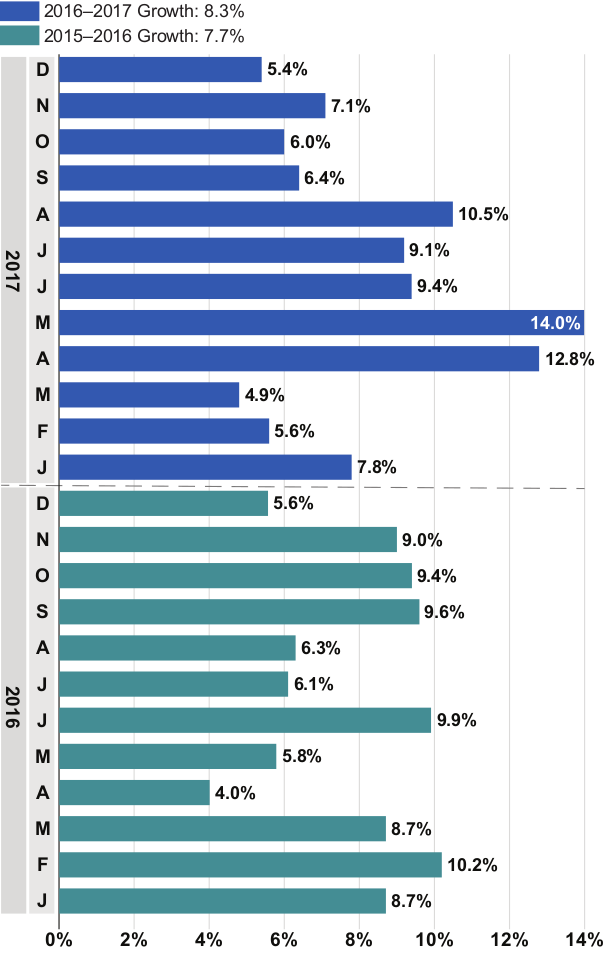
Passengers 2016 vs 2017
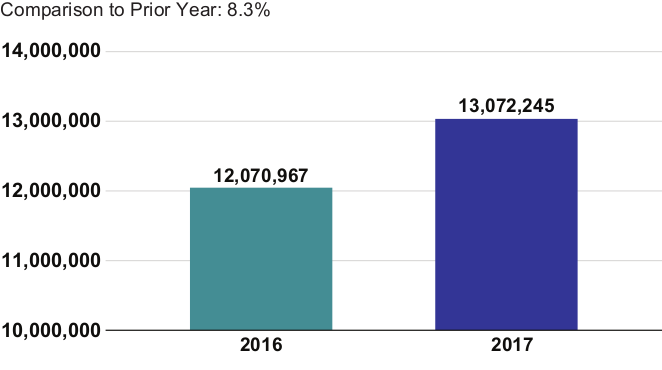
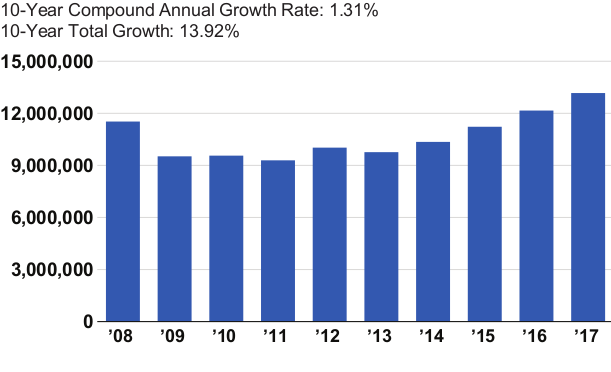
Historical Passenger Activity
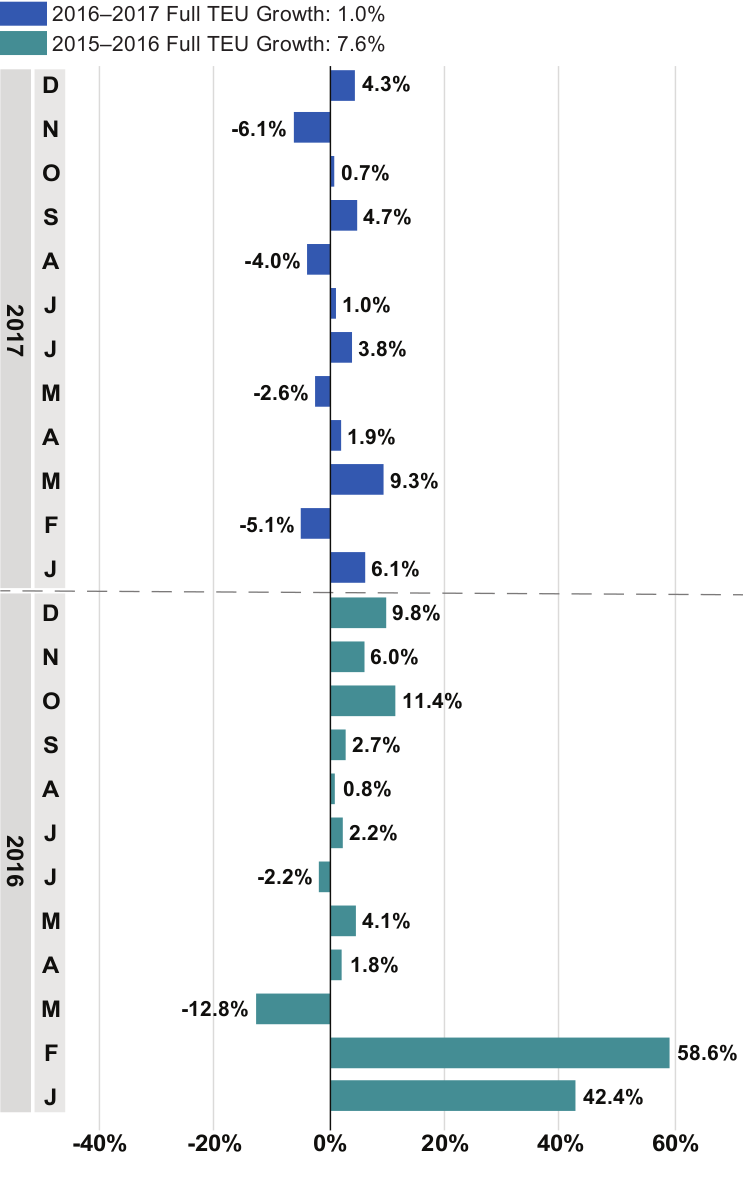
Monthly Full TEU Year over Year Growth
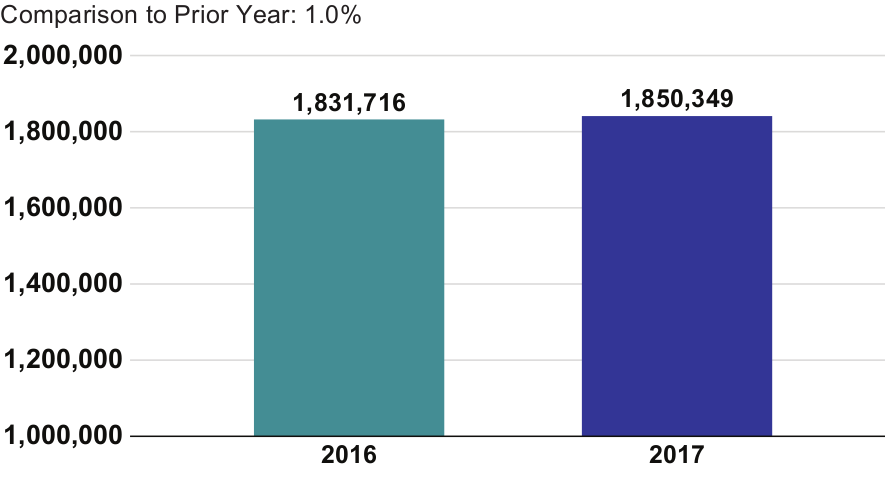
Full TEUs 2016 vs 2017
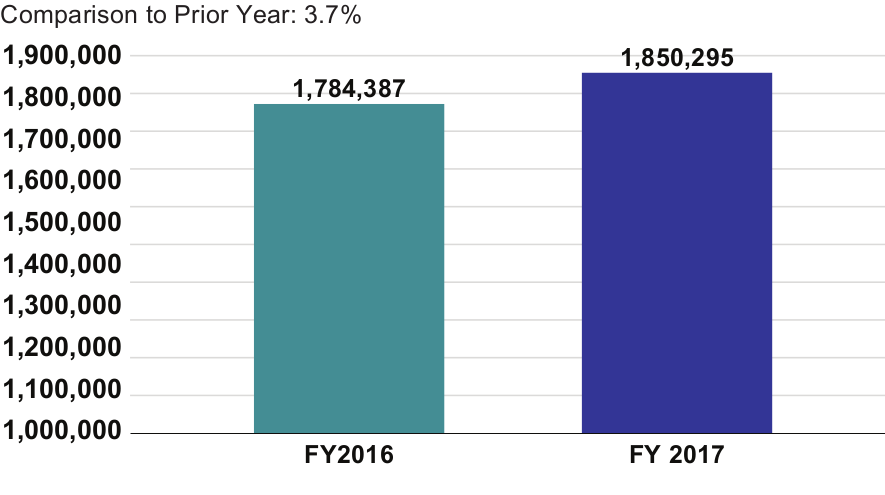
Full TEUs FY2016 vs FY 2017
Vessel Calls 2016 vs 2017