Seaport Facts & Figures
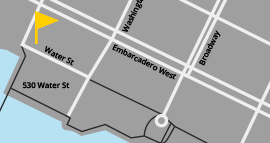
The Port of Oakland was established in 1927, and is a world-class international cargo transportation and distribution hub. Located on the mainland shore of San Francisco Bay, one of the great natural harbors of the world, Oakland was among the first ports globally to specialize in the intermodal container operations which have revolutionized international trade and stimulate the global economy.
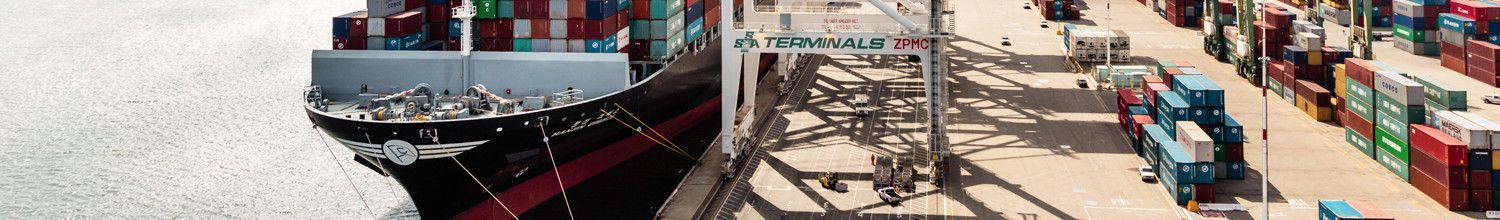
Five container terminals and two intermodal rail facilities serve the Oakland waterfront. All shipping channels and 90% of berths at the Port are dredged to -50 feet, capable of accommodating vessels up to 13,000 TEU capacity. The Union Pacific and BNSF railroad facilities are located adjacent to the heart of the marine terminal area to provide a reliable and efficient movement of cargo between the marine terminals or transload facilities and the intermodal rail facilities. For more information on the marine terminals, rail and other support service providers, go to the Terminal Specifications and our Service Directory.
The Port of Oakland loads and discharges more than 99 percent of the containerized goods moving through Northern California, the nation's fourth largest metropolitan area. Oakland's cargo volume makes it the fifth busiest container port in the United States, and ranks San Francisco Bay among the three principal Pacific Coast gateways for U.S. containerized cargoes, along with San Pedro Bay in southern California and Puget Sound in the Pacific Northwest. About 75.82 percent of Oakland's trade is with Asia. Europe accounts for 13.52 percent, Australia/New Zealand and Oceania about 5.25 percent and other foreign economies about 5.38 percent. About 0.2 percent of Oakland's trade is domestic (Hawaii and Guam) and military cargo. California's three major container ports carry approximately 50 percent on the nation's total container cargo volume.
CONTAINER STATISTICS
Port of Oakland Teu's Activity (2017)
| Month | Full | Empty | Grand Total | Trend* | ||||||
| Import | Trend* | Export | Trend* | Import | Trend* | Export | Trend* | |||
| January | 80,441 | 3.6% | 73,352 | 9.0% | 17,178 | 2.2% | 26,339 | -10.5% | 197,310 | 3.2% |
| February | 64,106 | -9.2% | 72,585 | -1.2% | 15,182 | 8.9% | 23,029 | -23.6% | 174,902 | -7.0% |
| March | 67,517 | 19.1% | 82,419 | 2.4% | 20,106 | 9.2% | 28,954 | 23.9% | 198,996 | 11.2% |
| April | ||||||||||
| May | ||||||||||
| June | ||||||||||
| July | ||||||||||
| August | ||||||||||
| September | ||||||||||
| October | ||||||||||
| November | ||||||||||
| December | ||||||||||
| YTD | 212,064 | 3.5% | 228,356 | 3.2% | 52,466 | 6.7% | 78,322 | -5.5% | 571,208 | 2.3% |
Container History
Port of Oakland Teu's Activity (2000 - 2016)
| Year | Full | Empty | Grand Total | Trend* | ||
|---|---|---|---|---|---|---|
| Import | Export | Import | Export | |||
| 2000 | 503,858 | 818,521 | 244,359 | 210,184 | 1,776,922 | +6.8% |
| 2001 | 486,389 | 758,958 | 223,894 | 174,344 | 1,643,585 | -7.5% |
| 2002 | 547,230 | 732,537 | 206,418 | 221,642 | 1,707,827 | +3.9% |
| 2003 | 599,411 | 799,547 | 206,267 | 317,879 | 1,923,104 | +12.6% |
| 2004 | 694,314 | 813,716 | 184,863 | 354,611 | 2,047,504 | +6.5% |
| 2005 | 836,258 | 846,579 | 197,988 | 393,165 | 2,273,990 | +11.1% |
| 2006 | 877,778 | 840,145 | 192,455 | 481,367 | 2,391,745 | +5.2% |
| 2007 | 870,284 | 909,633 | 204,943 | 403,051 | 2,387,911 | -0.2% |
| 2008 | 796,404 | 910,700 | 192,569 | 333,860 | 2,233,533 | -6.5% |
| 2009 | 701,501 | 966,882 | 209,258 | 167,570 | 2,045,211 | -8.4% |
| 2010 | 802,657 | 955,579 | 209,878 | 362,343 | 2,330,457 | 13.9% |
| 2011 | 797,272 | 993,826 | 264,471 | 286,957 | 2,342,526 | 0.5% |
| 2012 | 791,672 | 986,452 | 271,068 | 294,711 | 2,343,903 | 0.1% |
| 2013 | 803,314 | 1,014,796 | 270,535 | 257,919 | 2,346,564 | 0.1% |
| 2014 | 845,810 | 969,378 | 254,636 | 324,245 | 2,394,069 | 2.0% |
| 2015 | 844,234 | 858,146 | 196,677 | 378,464 | 2,277,521 | -4.9% |
| 2016 | 883,647 | 948,574 | 227,816 | 309,594 | 2,369,631 | 4.0% |
* Denotes change versus same time period from previous year
TRADING PARTNERS
Port of Oakland Top 10 Trading Partners By Tonnage – Imports (Containerized)
CALENDAR YEAR 2016
| COUNTRY | METRIC TONS | % SHARE |
|---|---|---|
| China | 2,481,508 | 36% |
| Taiwan | 323,572 | 5% |
| Thailand | 280,669 | 4% |
| Australia | 226,752 | 3% |
| Vietnam | 226,373 | 3% |
| India | 217,636 | 3% |
| Italy | 211,275 | 3% |
| South Korea | 206,350 | 3% |
| Hong Kong | 203,621 | 3% |
| Chile | 199,777 | 3% |
| TOP 10 TOTAL | 4,577,534 | 67% |
| ALL OTHERS | 2,305,051 | 33% |
| TOTAL | 6,882,585 | 100.0% |
Port of Oakland Top 10 Trading Partners By Tonnage – Exports (Containerized)
CALENDAR YEAR 2016
| COUNTRY | METRIC TONS | % SHARE |
|---|---|---|
| China | 2,693,319 | 34% |
| Japan | 1,033,657 | 13% |
| South Korea | 666,303 | 9% |
| Taiwan | 398,891 | 5% |
| Hong Kong | 280,095 | 4% |
| Vietnam | 170,242 | 2% |
| United Arab Emirates | 154,363 | 2% |
| United Kingdom | 157,223 | 2% |
| Turkey | 131,148 | 2% |
| India | 123,014 | 2% |
| TOP 10 TOTAL | 5,808,254 | 75% |
| ALL OTHERS | 1,944,349 | 25% |
| TOTAL | 7,752,603 | 100.0% |
COMMODITIES
Top 10 Commodities By Tonnage - Imports (Containerized)
Calendar Year 2016
| COMMODITY | METRIC TONS | % SHARE |
|---|---|---|
| Beverages & Spirits | 629,678 | 9% |
| Furniture | 512,401 | 7% |
| Glass & Glassware | 355,979 | 5% |
| Electrical Machinery | 288,160 | 4% |
| Plastics | 252,946 | 4% |
| Wood and Articles of Wood | 246,684 | 4% |
| Articles of Iron & Steel | 234,485 | 3% |
| Machinery | 229,514 | 3% |
| Rubber | 218,729 | 3% |
| Paper and Paperboard | 210,567 | 3% |
| Top 10 Total | 3,179,143 | 46% |
| All Others | 3,703,442 | 54% |
| Grand Total | 6,882,585 | 100% |
Source: U.S. Dept of Commerce, Bureau of Census
Port of Oakland Top
10 Commodities By Tonnage - Exports (Containerized)
Calendar Year 2016
| COMMODITY | METRIC TONS | % SHARE |
|---|---|---|
| Wood Pulp | 1,535,834 | 20% |
| Edible Fruits and Nuts | 1,076,155 | 14% |
| Meats | 449,456 | 6% |
| Beverages & Spirits | 439,476 | 6% |
| Cereals | 414,188 | 5% |
| Oil Seeds and Olaginous Fruits | 392,240 | 5% |
| Preparations of Vegetables | 305,569 | 4% |
| Iron & Steel | 288,652 | 3% |
| Plastic and Article of Plastic | 238,652 | 3% |
| Aluminum and Article of Aluminum | 123,873 | 2% |
| Top 10 Total | 5,601,369 | 73% |
| All Others | 2,112,837 | 27% |
| Total | 7,714,206 | 100.0% |
Source: U.S. Dept of Commerce, Bureau of Census